Performance Analyzer is a developer tool that can help visualize PL/SQL profiling data gathered by the Oracle DBMS_PROFILER. By using this tool, developers will be able to identify performance bottlenecks in PL/SQL logic. DBMS_PROFILER gathers information at the PL/SQL virtual machine level. This information includes the total number of times each line has been executed, the total amount of time that has been spent executing that line, and the minimum and maximum times that have been spent on a particular execution of that line etc. Developers can analyze all these data through the Performance Analyzer.
Configuring the analyzer involves few manual steps! Developer must have access to the environments interested using SYS and APPOWNER privileges. First three steps listed below needs to be performed once for each database instance, even when having several Application owners.
After successfully completing above steps, Performance Analyzer is completely installed. To access client forms related to Performance Analyzer, the user who is profiling needs to have FND_DEVELOPER grant as well. If the user doing the profiling is not appowner, then the executing user must have Oracle system privilege CREATE ANY PROCEDURE granted, otherwise that user will not see any result in the Performance Analyzer forms. Keep in mind to remove the system privilege after profiling is completed.
After installing the profiler following steps in Configuring the Analyzer, the user is ready to start profiling using following steps.
After above steps, the profiling data is ready for analysis. To analyze, start by opening Performance Analyze Overview window
After profiling, analyzing can be performed with the help of Performance Analyze Overview, Performance Analyze Details and Unit details windows. The best starting point will be Performance Analyze Overview window. This form lies in Developer tools -> Performance Analyzer section.


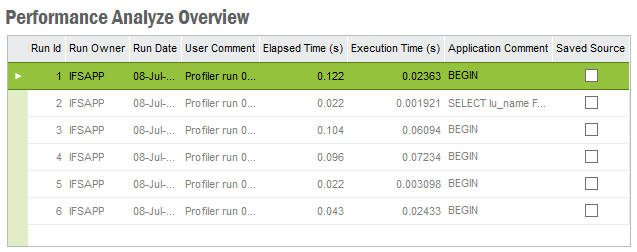
Performance Analyze Overview window contains all profiler runs performed. Note that a single profiling session can end up with several profiler runs with different Run Id s. From the Application Comment column, the developer can get an idea of the PL/SQL statement that got profiled in the run. Run Owner column indicates the user responsible for the run, User comment is the comment given in the debug console for the profiling session, Elapsed time is the time taken for the entire run, Execution Time is the time taken for the execution of each and every PL/SQL lines in the run. By looking at elapsed and execution times, developer can get an idea on the statement that takes most amount of time to complete. Saved Source Column indicates whether the gathered source level profiling data for a run is stored for later comparison in case the developer tweak the source code to improve performance and he/she needs old data to compare. Saving the run can be achieved with the RMB menu option 'Save Source' available for this window.
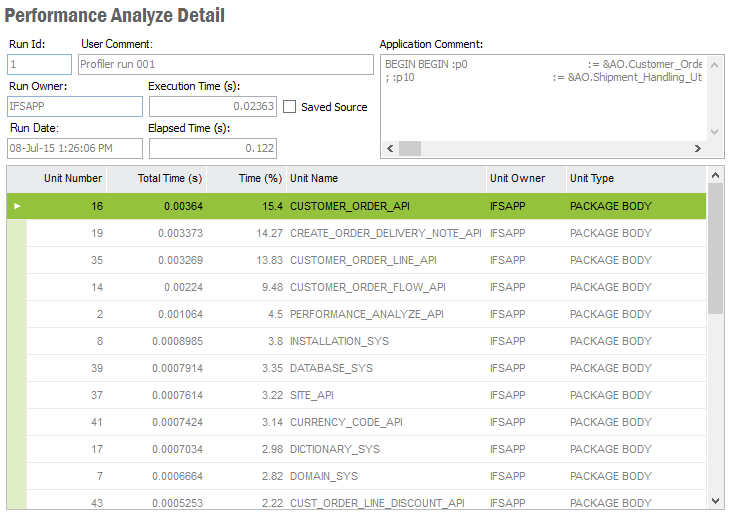
Once the developer identifies the run that may causes the performance issue, he/she can drill down further by navigating to Performance Analyze Detail using the RMB option 'View Details...'

This view gives an idea of what API's used in the run and how much time the run spent executing PL/SQL statements within each API (Unit). For example, in the above screenshot, CUSTOMER_ORDER_API has taken 15.4% of the total execution time of the run. From this view, the developer can drill down to code level details using RMB menu 'Unit Detail...' to see what line may have caused the most amount of time.

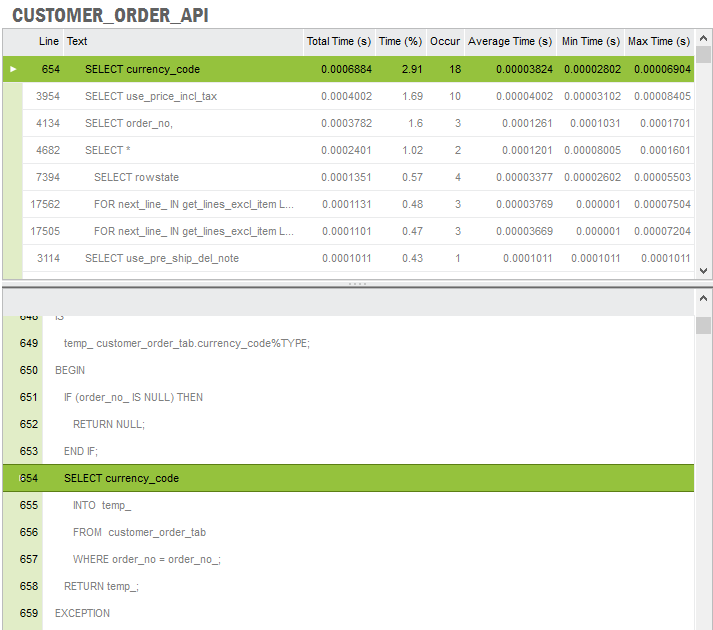
From this view, from the top table, the developer can see each and every line executed with the amount of time taken for the execution. from the results in this example, it can be seen that the line 'SELECT currency_code' got executed 18 times with an average of 0.00003824 seconds per execution adding up to 2.91% of the total execution time of this particular unit.
From the bottom child table, the developer can see entire code of the unit. In this example: CUSTOMER_ORDER_API. If the developer selects a particular line from the top child table, the bottom view will update accordingly and move to the corresponding line.